How does a company like New Relic post 70 plus percent revenue growth year-over-year? How has Veeva transformed the conversation about vertical SaaS, continuing to grow at 50 percent, even with a highly targeted set of industry-specific customers?
Behind these and numerous other top line success stories is a compelling narrative. Long before their IPO, many of the most successful subscription companies became very good at retaining and growing their customer relationships over time. Veeva and New Relic are particularly strong in this respect, but data suggests that their excellence may be part of a larger trend.
We looked at data from 17 public companies to identify what we can learn about retention from today’s leading subscription companies. The results validate the importance of success in this domain:
• Median net retention stands at 100 percent, meaning that the median company gains at least as much recurring revenue as it loses from each cohort of customers over time.
• The top half of companies in net retention grow at nearly twice the rate of companies in the bottom half, suggesting that net retention is one of the key ways in which hyper-growth companies become hyper-growth companies.
• Companies are positioned to invest more in sales and marketing for each dollar of new business that they acquire, and appear to take advantage of this in practice, something which may give them a powerful competitive edge.
WHY IS NET RETENTION SO POWERFUL?
Net retention is powerful because it makes a non-linear contribution to growth. It’s either a dividend or a tax that you pay on every group of customers that you acquire, and the more customers you acquire over time, the more this adds up.
Let’s use an example to bring this to life. While it’s not hard to imagine how revenue growth could be linked to retention, the strength of the relationship over the longterm is striking.
Imagine a company that adds $1,000 of new monthly recurring revenue through new customer acquisition. Now, imagine two different versions of that company: A and B.
Company B is better at growing customer relationships over time. For Company B, upsells and revenue expansion with existing customers slightly outpace lost revenue from churn and downsells, giving them a net dollar retention of 101 percent month over month. On the other hand, Company A is slightly worse at customer relationships than Company B, and has a net dollar retention of 99 percent month over month.
At first, the revenue performance of the two companies is similar, but, over the course of five years, their fates diverge dramatically. After that much time, Company B has almost twice the revenue of Company A and a dramatically different growth trajectory. Their success with existing customers has a compounding effect over time.
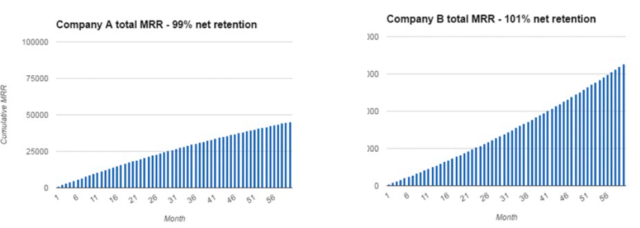
That, plus or minus one percent difference in monthly retention, translates to plus or minus about 12.5 percent in annual retention! Differences in net retention performance can be at least that dramatic in the wild.
For instance, while some companies report net dollar retention numbers that are less than 100 percent, Veeva reported “Annual Subscription Revenue Retention Rate” was 138 percent in their annual report for 2015. New Relic reported quarterly “dollar based expansion rates” that reached above 130 percent over their most recent year.
HOW DO COMPANIES MEASURE NET RETENTION?
Before we dive in and explore more of the data, it’s important to spend some time talking about what this measure really means. Because this is a non-GAAP metric, there are a number of methodologies used by public companies to report retention.
Five9, which makes call center software, uses an invoicing-based measure. To arrive at an “Annual Dollar Based Retention Rate,” they divide their current monthly invoicing by their invoicing from the same group of clients from a year prior, then they calculate a 12 month average. Or:
12 month average of (Recurring Invoicing in current month) / (Recurring Invoicing from same month one year ago)
Hubspot, which makes demand generation software, uses MRR. They divide the aggregate contractual monthly recurring revenue of their customer base at the end of each month by the aggregate CMRR of the same group of customers at the beginning of that month, and then arrive at a twelve month weighted average. Or:
(12 month weighted average of (CMRR at end of month) / (CMRR at beginning of month))^12
Marketo, which similarly makes marketing automation engagement software, looks at aggregate GAAP revenue. They compare the aggregate monthly subscription revenue of their customer base in the last month of the prior year fiscal quarter, to the aggregate monthly subscription revenue generated from the same group in the last month of the current quarter. Then they calculate a weighted average “Subscription Dollar Retention Rate” of the four fiscal quarters within the year. Or:
4 quarter weighted average of (GAAP subscription revenue from last month of quarter) / (GAAP subscription revenue from last month of same quarter one year ago)
In spite of differences in the underlying metric and approach to crafting this ratio, they have a lot in common.
• Look at a group of customers that were present at t = n and understand how much recurring revenue you were receiving from them
• Look at the same group of customers at t = n+1 and determine how much the recurring revenue from that group of customers has increased or decreased
Doing this on a dollar-basis with upsells included is particularly powerful. This takes into account both your effectiveness in reducing churn and your effectiveness in growing your customer relationships over time. As a result, it translates directly into the expected lifetime value of each new customer you acquire.
For example, in the simplified lifetime value model below, GC is yearly gross contribution, d is the discount rate, and r is the yearly net dollar retention.
Lifetime Value = GC * (r / (1 + d – r))
At Zuora, we prefer methods involving ARR (annual recurring revenue) or MRR (monthly recurring revenue) as the base metric. You would measure ARR net retention using the formula below.
Net ARR retention = ARR t = n + 1 / ARR t = n
Since these point-in-time metrics reflect changes to subscriptions immediately, they provide a better leading indicator of net retention. If a customer churns near the end of a period, the entire impact is reflected in the impact on ARR, while the impact on GAAP revenue for that period is prorated and therefore significantly smaller. The full impact on GAAP revenue would not appear until the following period.
That said, regardless of how a company calculates net retention, what is crucial is the underlying performance itself. Below we mine some of the publicly available data in order to explore how widely performance ranges and how important retention is.
WHAT CAN WE LEARN FROM COMPANIES BEFORE US?
Net retention is not a GAAP metric and does not have a standard definition. Nonetheless, as a testament to the growing attention to this performance measure, dozens of public companies now report retention figures in their public filings. We spent some time studying this data recently and think there are several important trends worth noting.
The standard for public companies is high. Among the public company reports that we studied, the mean is over 100 percent revenue retention. Some leading companies report revenue retention numbers over 150 percent for certain periods. This suggests that customer delight and focus on relationship growth is the new normal.
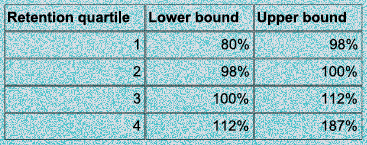
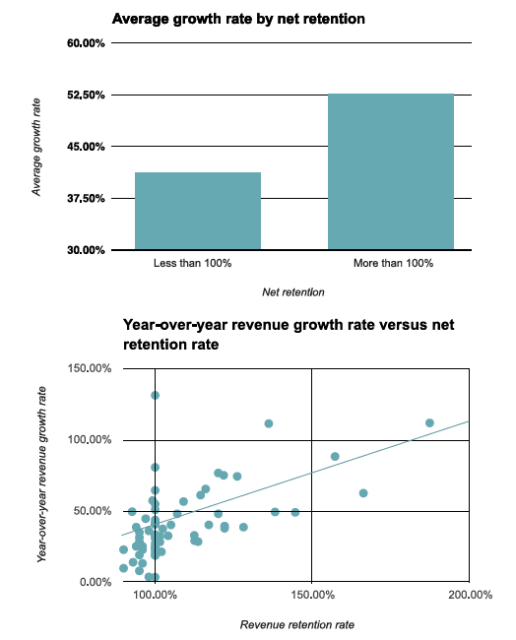
Companies with greater net retention grow faster. Companies with below average retention rates grew at an average of 36 percent year-over-year while companies with above average rates grew at an average of 59 percent year-over-year.
Finally, companies with high net retention may wield this as a competitive weapon. One important decision that companies face is how much to invest in sales and marketing expense. Net retention plays an important role there. Because companies with higher net retention have higher customer lifetime value, they might be able to justify a greater investment in upfront customer acquisition.
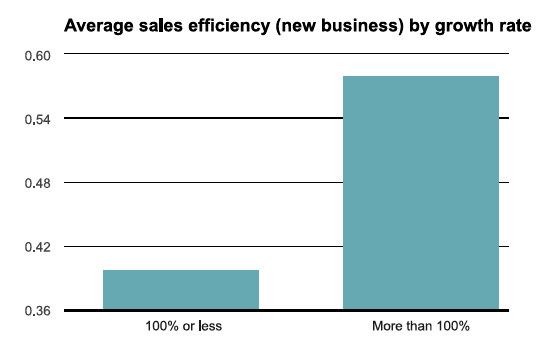
To see how this plays out in practice, we’ll look at two additional metrics:i) how much overall additional revenue a company gets for $1 in sales and marketing spend (overall sales efficiency); and ii)how much revenue from new customers a company gets for $1 in sales and marketing spend (new business sales efficiency).
When we compare overall sales efficiency with net retention, companies with high net retention generally look similar to, if not more efficient than, their peers. This makes sense at some level. Expanding relationships with existing customers typically requires less sales and marketing investment than acquiring new customers. Great examples of this are available in Pacific Crest’s annual survey of SaaS metrics.
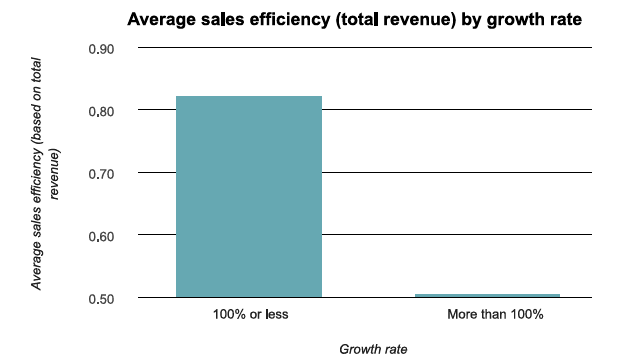
On the other hand, when we look at the amount of sales and marketing spend relative to the amount of new business, the numbers tell a different story. High net retention companies may be able to justify a greater upfront investment in new customer acquisition. Because of their strong customer relationships, these high net retention companies not only win in the long-term but also take advantage of their position to win the acquisition battle upfront.
These These are only a few of the interesting relationships that you can find and we encourage further exploration.
WHAT STEPS CAN YOU TAKE NOW?
We expect that business’ net retention performance will only continue to become more crucial over time. Companies that excel in this arena are likely to grow faster and be able to justify greater investment in growth than those that do not.
The good news is that there have never been more resources and knowledge available for companies interested in doubling down on customer relationships. If you would like a starting point for this journey, here are some of the key areas that we encourage our customers to focus on and important questions we encourage them to ask.
Understanding outcomes and drivers: What is my net retention? What’s driving it to be high or low? To what extent is it controlled by churn, expansion, or contraction in recurring revenue?
Gaining a single view of each of your subscribers: What do you know about the identity of each of your subscribers? What are all of the moments your subscribers experience in their interaction with you?
Linking outcomes with subscriber behaviors: How do the identity of your subscribers and the moments that they experience make them more or less likely to churn or grow? What segments can you identify across your subscriber base?
Triggering the right action: As you identify new customers in segments (e.g., renewals at risk), how do you take action as an organization? How do you conduct experiments to test different intervention strategies? And how do you learn from those experiments in a systematic way?
Needless to say, there is a lot more to discuss.